Master Your Data with Gnuplot
The most reliable, portable, and powerful command-line graphing utility. From simple 2D plots to complex 3D scientific visualizations—Gnuplot 6.0 handles it all with precision.
* Supports Windows (including ARM64), macOS, Linux, and more.
gnuplot> splot f(x,y) with pm3d
Why Choose Gnuplot for Data Visualization?
For four decades, Gnuplot has been the gold standard for scientists, engineers, and data analysts worldwide. It combines the power of professional scripting with the speed of lightweight execution.
Advanced 2D & 3D Plotting
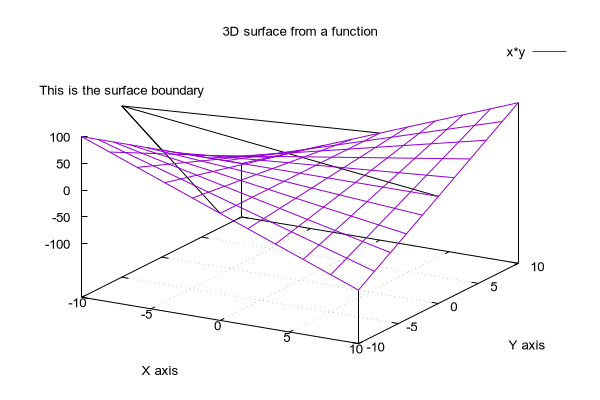
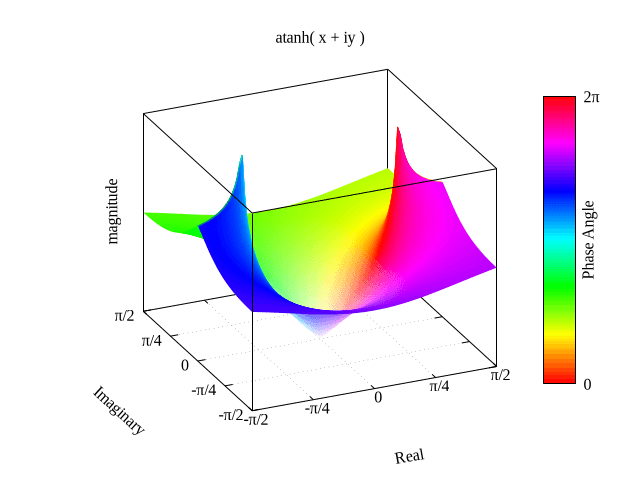
Create stunning scatter plots, line graphs, bar charts, and contour plots. The pm3d engine allows for sophisticated 3.5D color-mapped surfaces and vector fields.
Scripting & Automation
Perfect for batch processing. Gnuplot can be fully automated via scripts, making it the ideal plotting engine for web servers, C/C++, Python, and Octave workflows.
Professional Export Formats
Export to publication-quality formats including PDF, SVG, EPS, and LaTeX. High-resolution PNG and JPEG outputs are available for web and presentations.
New in Version 6.0
Experience enhanced performance with Function Blocks, watch-points, and full support for Windows ARM64 architecture and modern C23 standards.
Built for Professionals & Students
Whether you are publishing a paper in Nature or finishing a lab report, Gnuplot provides the precision you need.
Publication-Quality Plots
Scientists trust Gnuplot for its pixel-perfect accuracy. Automatically generate LaTeX-friendly diagrams, complex contour maps, and multi-axis plots that meet the strict requirements of top-tier academic journals.
- ✓ Seamless LaTeX/TikZ integration
- ✓ Advanced error bar handling
- ✓ Non-linear least-squares fitting
Automation & Scripting
Engineers use Gnuplot to monitor real-time data or batch-process millions of log entries. Its headless mode and piping capabilities make it a favorite for Linux server environments and embedded systems.
- ✓ Lightweight, zero-GUI overhead
- ✓ Pipes and standard input support
- ✓ Extensive terminal support (Sixel, Kitty, Qt)
Powerful Plotting, Simple Syntax
Experience how Gnuplot turns a few lines of code into publication-quality graphics.
Analysis:
This 3D “Mexican Hat” function demonstrates Gnuplot’s ability to handle complex surfaces with automatic hidden line removal and professional color palettes like Viridis.
fit f(x) 'data.txt' via a,b
Built-in Fitting Engine
plot 'log.dat' using 1:2:3
Multi-Column Data Handling
set terminal svg dynamic
Interactive Web Exports
Gnuplot vs. The Competition
How does Gnuplot stack up against other popular scientific plotting tools? Let’s compare the core metrics.
| Feature | Gnuplot 6.0 | Matplotlib (Python) | Excel / Sheets |
|---|---|---|---|
| Learning Curve | Moderate (Script-based) | High (Requires Python) | Low (GUI-based) |
| Large Data Support | Excellent (Very Fast) | Good (Memory intensive) | Poor (Crashes easily) |
| 3D Visualization | Professional / Advanced | Very Good | Basic / Limited |
| Output Quality | Publication Grade (LaTeX) | Publication Grade | Web / Office Grade |
| Installation Size | ~30 MB (Ultra-light) | ~500 MB+ (Environment) | GBs (Full Suite) |
Verdict: While tools like Python’s Matplotlib are great for deep data science, Gnuplot remains the fastest and most efficient way to generate high-quality plots without the overhead of heavy programming environments. It is the best choice for cross-platform automation and publication-ready results.
Frequently Asked Questions
Quick answers to common questions about Gnuplot 6.0.
Q: Is Gnuplot really free and open source?
Yes, Gnuplot is free to download and use. While it has its own unique license (it is not GPL), the source code is publicly available and can be freely distributed. It has been maintained by a dedicated community since 1986.
Q: Does Gnuplot 6.0 support Windows 11 and ARM64?
Absolutely. The latest stable version 6.0.4 includes native support for Windows 10/11, including the newer ARM 64-bit architectures found in Snapdragon-powered laptops and Surface devices.
Q: Gnuplot vs. Matplotlib: Which is better?
It depends on your workflow. Matplotlib is excellent for Python-integrated data science. Gnuplot is superior for standalone scripting, performance on large datasets, and portability across languages (C, Fortran, Java) and operating systems.
Q: How do I export Gnuplot graphs to my paper?
You can use the set terminal command. For LaTeX, use epslatex or cairolatex. For high-resolution images, pdf, svg, or pngcairo are the best choices for professional publication quality.
Have more technical questions? Check our upcoming Gnuplot Tutorial Series or the official documentation.
Quick Reference & Cheat Sheet
Bookmark this section for a fast reminder of essential Gnuplot commands.
Basic Plotting
plot sin(x) * exp(-x)
plot 'data.txt' using 1:2 with lines
splot f(x,y) with pm3d
Styling & Axes
set xlabel "Time (s)"; set title "Result"
set xrange [0:100]; set yrange [-1:1]
set grid xtics ytics
Output & Export
set terminal pngcairo; set output 'img.png'
set terminal pdfcairo; set output 'plot.pdf'
set terminal svg dynamic size 600,400
40 Years of Continuous Development
Originally created in 1986 by Thomas Williams and Colin Kelley, Gnuplot has evolved from a simple student tool into a sophisticated plotting engine used by institutions like CERN and NASA.
Despite its name, it is not part of the GNU project, yet it remains one of the most successful examples of open-source academic software, maintained by a core team of developers for four decades.
Join the Community
Gnuplot development is transparent and active. You can track the latest changes directly from the official repositories.
Ready to Visualize Your Data?
Join thousands of scientists and engineers using the most stable version of Gnuplot. Fast, free, and incredibly powerful.
Legal Disclaimer: Gnuplot.xyz is an independent community-driven resource and download portal. This website is not the official gnuplot website, nor is it affiliated, endorsed, or sponsored by the original gnuplot developers (Thomas Williams, Colin Kelley, and the gnuplot team).
The gnuplot software is copyrighted but freely distributed under its own license. All trademarks and registered trademarks mentioned on this site are the property of their respective owners. The official gnuplot project can be found at gnuplot.info.